As noted in my earlier article about CBRM transit, the study that will guide the electrification of our system will consider the examples of other, comparable, municipalities. During their discussion of the matter earlier this month, some councilors expressed the concern that comparing us to Halifax—which ordered 60 electric buses in July 2021 as part of a $112 million agreement with the provincial and federal governments—isn’t really fair.
Councilors mentioned municipalities like Charlottetown, Moncton (served by Codiac Transpo which also covers Dieppe and Riverview) and Saint John, so I started out by gathering some basic information about these places:
| Metric | CBRM | Charlottetown | Saint John | Codiac (Moncton-Dieppe-Riverview) | Halifax |
|---|---|---|---|---|---|
| Population | 94,285 | 36,094 | 67,575 | 116,940* | 403,131 |
| Population percentage change 2011 to 2016 | -3.2 | 4.4 | -3.6 | 4.1 | 3.3 |
| Population density per square kilometer | 38.8 | 814.1 | 213.9 | 506.5 | 73.4 |
| Land area in square kilometers | 2,430.06 | 44.34 | 315.96 | 141.92 | 5,490.35 |
| Median household income | 53,833 | 53,736 | 52,132 | 56,062 | 69,553 |
| *2018 figure |
Note: In the case of Saint John, the area served by its transit service is actually larger than 315.96 square kilometers because the system includes a number of suburban communities, but more about that in a moment.
As I was poking around the internet, I discovered that Saint John had completed a Transit Operational Audit of Saint John Transit (SJT) in 2020 (although the most recent data in the report dates to 2018 and COVID is mentioned only as something that will eventually pass) and in skimming the Saint John report, I discovered that Stantec had previously performed the same service for Fredericton, or at least a similar service, Fredericton got a Strategic Transit Plan in 2019. (I think, from comments that have been made in CBRM council meetings, that these studies are required of municipalities hoping to tap into federal funding for zero-emissions vehicles, not some sort of fad sweeping the region.)
I found both these reports on Tuesday, so have not had time to read them through (and honestly, I don’t think reading a detailed report about another city’s transit service would necessarily be helpful) but I found some information in the Saint John report that seemed interesting and/or applicable to our situation and that’s, basically, what this article is going to be about.
Peer pressure
Saint John paid Stantec $100,000 to perform its transit audit. City councilors, according to the CBC, hoped it would “find up to $2 million in savings.”
Then-Councilor (now Mayor) Donna Reardon told the broadcaster that SJT worked “from a $12 million operating budget, with $5 million coming from fares, another $5 million coming from city funding. The city also carries about $2 million for debt servicing, to help with capital costs. (That is considerably more than the Transit Cape Breton’s 2022 operating budget of $6.9 million of which $2 million is expected to come from fares.)
Luckily for us, Stantec chose a few cities to compare to Frederiction and Saint John so we can get a peek at transit agencies elsewhere in New Brunswick as well as in Ontario, Alberta and Manitoba. (Stantec is quoting data from CUTA, the Canadian Urban Transit Association and I got excited for a moment, thinking I could go straight to the source and view CUTA data myself but the annual membership fee was a little too rich for my blood.)
In the Saint John report, Stantec compared SJT to seven other transit systems, chosen based on “comparable ridership, agency size, and service area to Saint John.” Stantec said it reviewed “service area population” for all these peer agencies “to get a sense of any trends or growth,” but the key for the comparison is that each has a “similarly sized transit system” serving a population between 50,000 and 150,000:

In the Fredericton report, Stantec used a similar grouping, but dropped Saint John and St. John’s and added Brandon Manitoba:

If you read my first transit article this week, you’ll know Transit Cape Breton is on track for ridership of 1.2 million in 2022, which means that although its service area population is similar to that of SJT (which serves Saint John, Quispamsis, Rothesay, Hampton and Grand Bay), its ridership is significantly lower.
Another interesting graph from the Stantec Saint John report shows the relation between ridership and population change and it’s not always what you’d think it would be:

Here’s the same graph from the Fredericton report; as you can see, the reference dates are earlier:
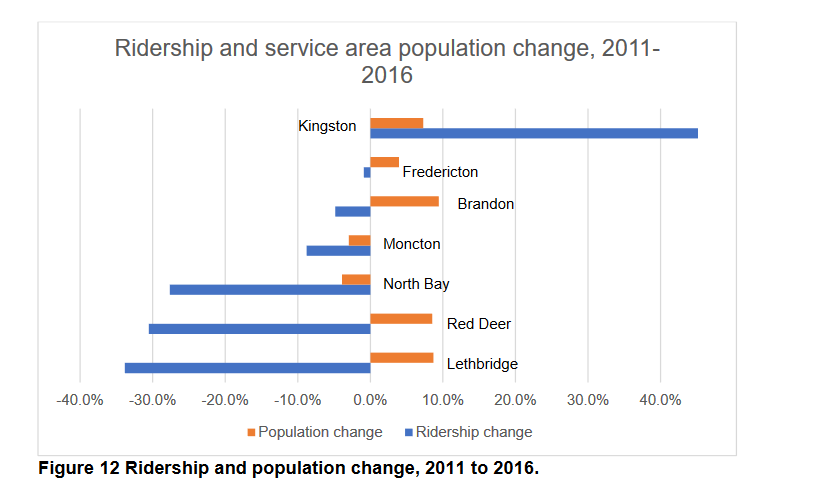
I was hoping for an explanation of just what is going on in Moncton—its population declines but transit ridership explodes? But the authors didn’t have much to say about this, I guess they’re saving it for the Moncton report. I found some articles from 2015 about Codiac Transpo redirecting $40,000 from its fuel budget to a campaign to attract new riders that included offering free rides to high school students for the summer. The stories say that at the time the campaign was launched, the system was carrying 6,600 riders per day (Transit Cape Breton carries about 4,300).
Stantec did offer some thoughts about what’s happening in Kingston, Ontario, although Kingston seems to have drafted its most recent transit plan in-house:
Kingston Transit’s ridership grew by 46.1% over the same period, and some of these gains likely resulted from population growth, as well as a pilot project that introduced free transit for youth 14 years and younger, a new “BRT-lite” service and mandatory U-Pass programs at three post-secondary institutions.
“BRT” is Bus Rapid Transit and I found this handy explanation of the difference between regular BRT and BRT-lite:

(Source: The BRT and the danfo: A case study of Lagos’ transport reforms from 1999-2019)
As for the mandatory U-Pass program, according to Kingston’s transit plan:
Kingston Transit has agreements with the student governments at Queen’s University and St. Lawrence College that provide eligible students with unlimited access to Kingston Transit services. All eligible students are assessed a mandatory student fee. The revenue levels associated with these agreements is negotiated separately from any changes to fares.
Interesting.
Rolling Stock
But back to Saint John.
SJT’s fixed route service consists of 22 routes divided into five categories based on the area they serve. (Transit Cape Breton has just 13 daytime routes and 12 evening routes.) These routes include three express commuter services connecting Quispamsis, Rothesay and Hampton to Uptown. SJT also offers Handi-Bus service. It has a fleet of 46 buses, 8 Hand-Buses and five motor vehicles (Transit Cape Breton has 37 buses including 8 Handi-Trans buses) and its buses range in age from one to 16 years with an average age of about eight, “which is old considering that many transit agencies retire their vehicles after 12-14 years an tend to have an average age of a little over 6 years.” (Stantec advises SJT to retire five of its buses, arguing the service has maintained its fleet size despite service reductions over the past few years.)
SJT routing is designed with a goal “that 85% of the population is within 500m of a transit route,” a metric that is not currently being met, “likely due to the dispersed nature of the City which makes it challenging to offer adequate amounts of coverage in an effective manner.” (CBRM taxes residents who live within 2,500 feet or 760m of a bus route for transit.)
The audit breaks down average weekly ridership by route, measures on-time performance and reviews total revenue and expenses over the last 10 years to reveal an approximately $5 million shortfall.
Stantec was asked to trim $850,000 from the SJT budget but acknowledges its short-term recommendations would cut about $960,000: which is “not to suggest that it would be prudent for SJT to exceed this targeted budget reduction.”
It suggests changing some routes, improving marketing and updating the fare structure for the Handi-Bus service to be “consistent with conventional transit.” (In fact, Stantec warns that the City of Saint John could be subject to a New Brunswick Human Rights Act challenge as its practice of charging different fares for the two services “could be interpreted as being discriminatory to persons with disabilities and mobility challenges.”)
The report also advocates investing in the necessary technology to implement an on-request service for low-ridership routes:
Riders would specify their desired pick-up time or window, the size of which would be set by SJT as a policy decision. Small pick-up windows (ex. Pick up between 15 and 30 minutes of booking a trip) come with the advantage of offering an improved customer experience, while large pick-up windows (ex. Pick up between 3- 24 hours of booking a trip) come with the advantage of increased flexibility in trip grouping, and therefore in resource utilization and financial efficiency. With these inputted parameters, along with other SJT policy decisions such as maximum trip times and target number of passengers per vehicle, a software algorithm optimizes the route and scheduling of trips to create travel routes for drivers. As customers wait for their pick-up, they should also have the ability to track the trip so they know when to be ready to board.
Stantec says the service could be delivered using the agency’s Handi-Bus fleet, which “rarely” makes more than 120 trips in a day and “likely” has sufficient capacity.
As the report puts it:
…it is commonplace across the industry that paratransit fleets often have this spare capacity that can be filled by able-bodied customers booking on-request trips.
If the existing fleet proved not to have the necessary capacity, Stantec advises buying additional vehicles and it’s interesting to see what happened with that recommendation.
Zero-emissions
The Stantec report barely mentioned zero-emissions vehicles. The only reference I found was this one, on page 147:
Given the industry–wide desire for a move to zero– emission technology, a demonstration test would be a viable starting point for Saint John if there is appetite for this. The demonstration test would evaluate a vehicle’s suitability for the operating profile, i.e. confirming whether a full battery charge will be adequate for the entire day’s service hours. While exploring zero–emission buses may not be the most effective use of limited funds given the current financial situation of the City, dedicated grant and funding programs are becoming increasingly prevalent industry–wide, and SJT should begin thinking about this now, as the cost of being proactive is always less than the cost of being reactive.
But Saint John also has a plan, unveiled in April, to get rid of all the combustion-engine vehicles in its fleet by 2040. As part of this plan, it will test six electric buses, the first of which arrived a couple of weeks ago, from Ontario-based Damera Bus Corporation. And as the CBC reported:
Electric buses are tied in with the city’s plan for on-demand bus service. [Transit director Ian] Fogan said the transit commission hopes to launch the program in some areas of the city in September.
Fogan said they are targeting areas where ridership is low. He said it doesn’t make [economic] sense in those areas to have a bus arrive with the same frequency as on a busy route.
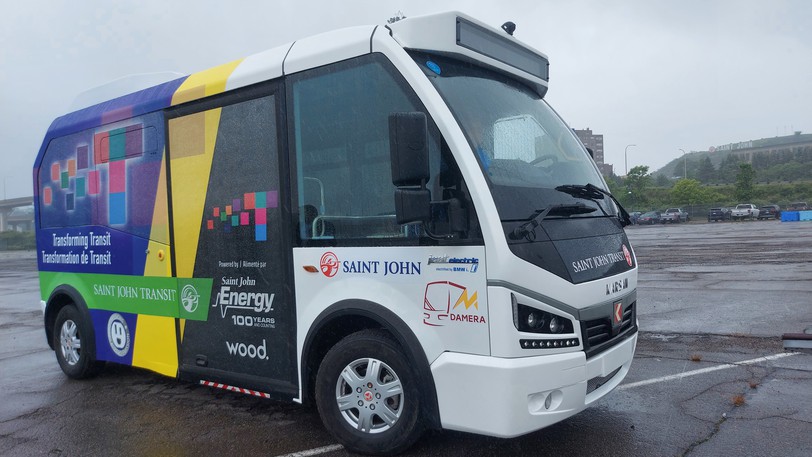
Saint John’s first 8-meter JEST electric bus.
It seems the City had initially decided to lease a 40-foot electric bus for testing purposes but:
…when the commission couldn’t find smaller buses for its on-demand service, they looked at some of the options they had previously explored for decarbonization.
Initially, they were just looking for smaller versions of traditional buses for the on-demand service, but then started looking more closely at a European-based company that makes eight-metre-long [20-foot] buses that are fully electric.
Fogan said the commission has leased six of them for a year in order to test them in all four seasons and on the city’s terrain.
“We just want to be able to put that to use in our own circumstances before making a firm commitment that this is the way we want to go. They’re also new to us, so new to our maintenance department, new to our drivers, and new to our riders. So let’s lease it. Let’s try it out and see what the response is.”
The buses, made by Turkey’s Karsan, are capable of running 300km on a charge, “well below the roughly 190-km-per-day maximum that the busiest of city buses are used to.” (During 2021-22 budget discussions here in CBRM, Engineering and Public Works Director Wayne MacDonald said we’d need electric buses that could run 500km to 600km on a charge “and they’re coming.”)
Fogan said he hadn’t found any other city in Canada running an on-demand system with an electric bus.
I was curious about the charging infrastructure, which obviously would be necessary for a year-long test run, so I wrote the City of Saint John and communications manager Erin White told me in an email:
Yes, charging infrastructure was part of the study around cost and cost savings when making the decision to switch to electric from carbon emitting technology. This cost is assumed in our decarbonization study. Charging infrastructure is a long-term investment, not only for this bus and the six we will be receiving in August, but for an eventual overall fleet conversion to electric buses.
And that’s all I’ve got for you on the subject of Saint John transit, other than to suggest that this experiment with on-request electric bus service is one the CBRM will watch with interest.