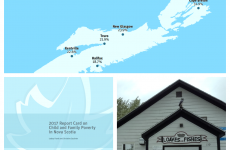
 Sydney-Victoria figured in a Canadian Top-10 list this week but it’s nothing to celebrate: we’re one of the 10 federal ridings with the highest levels of child poverty in the country.
The list is found in the latest report from Campaign 2000, a Canadian anti-poverty group that takes its name from a 1989 all-party House of Commons resolution to end poverty by 2000. (A moment of silence for that dream…)
The group calculates poverty rates using the low-income measure after tax (LIM-AT). What’s that, you ask? Well, here’s how Stats Canada, which produces the data, explains it (in what it calls, with a straight face, “simple terms”):
[T]he Low-income measure after tax (LIM-AT) is a fixed percentage (50%) of median adjusted after-tax income of households observed at the person level, where ‘adjusted’ indicates that a household’s needs are taken into account. Adjustment for household sizes reflects the fact that a household’s needs increase as the number of members increase, although not necessarily by the same proportion per additional member.
The LIMs derivation begins by calculating the ‘adjusted household income’ for each household by dividing household income by the square root of the number of persons in the household, otherwise known as the ‘equivalence scale.’ This adjusted household income is assigned to each individual in the private household, and the median of the adjusted household income (where half of all individuals will be above it and half below) is determined over the population. The LIM for a household of one person is 50% of this median, and the LIMs for other sizes of households are equal to this value multiplied by their equivalence scale.
Stats Canada says low-income lines like the LIM-AT are not measures of poverty. “Rather, low-income lines reflect a consistent and well-defined methodology that identifies those who are substantially worse off than average.”
I am going to trust that the good people at Campaign 2000 use the LIM-AT to measure poverty because being “substantially worse off than average” in Canada means, basically, that you’re poor.
The data in the Campaign 2000 report are organized in five ranges, called quintiles, each containing 67 ridings. The fifth and highest quintile comprises ridings with the greatest prevalence of child and family poverty. Poverty rates by quintile break down like this:
Fifth Quintile: 22.8% to 64.2%
Fourth Quntile: 18.7% to 22.7%
Third Quintile: 15% to 18.6%
Second Quintile: 11.9% to 14.9%
First Quintile: 4.1% to 11.8%
With 33% of our children living in poverty, Sydney-Victoria is not just the only Atlantic Canadian riding to rank among the 10 worst ridings in terms of child poverty, it’s the only Atlantic Canadian riding to rank among the 30 worst:

Source: Campaign 2000
Which is not to say children in other Nova Scotian ridings are so well off:
| Federal Riding | Child Poverty Rate (%) |
|---|---|
| Sydney-Victoria | 33.0 |
| Halifax | 24.9 |
| Cape Breton Canso | 24.2 |
| Cumberland/Colchester | 23.7 |
| West Nova | 23.6 |
| Dartmouth-Cole Harbour | 21.4 |
| Kings-Hants | 21.0 |
| Central Nova | 20.8 |
| Halifax West | 19.1 |
| South Share St. Margarets | 18.1 |
| Sackville-Preston-Chezzetcook | 12.7 |
And as Acadia University professor Lesley Frank points out in her commentary on the Campaign 2000 report for the Canadian Centre for Policy Alternatives (CCPA) , that ranking for the suburban riding of Sackville-Preston-Chezzetcook hides “inequities,” as it includes the African Nova Scotian communities of North and East Preston which have child poverty rates of 40% and 38.9%, respectively.
The Feds
That the breakdown of poverty in the country was done on the basis of federal electoral ridings is no accident: Campaign 2000, while acknowledging that all three levels of government have a role to play in combating poverty, says the federal government must take a leadership role.
The report itself has been released as the federal government prepares to announce Canada’s first federal Poverty Reduction Strategy (PRS), something Campaign 2000 has called for “for decades.”
The report credits the current federal government with taking some steps to combat poverty — including making “significant” investments in the Canada Child Benefit (CCB), the full impact of which has not yet been “fully captured by current data.” The authors also credit the feds with:
…action and investments in areas such as indexing the CCB to inflation as of 2018, investing to improve access to the CCB among Indigenous families, the redesign of the Working Income Tax Benefit to the new Canada Workers’ Benefit and funding for Statistics Canada to address key gaps in poverty measurement.
But the list of things still to be done to combat poverty is much longer — as summarized by Frank, it looks like this:
- A commitment to legislate bold and achievable targets and timelines for poverty reduction
- A strong focus on the eradication of poverty for Indigenous peoples
- Stabilized and adequate transfer payments to provinces
- Stronger income security programs for everyone
- Improved support for workers including better Employment Insurance coverage and rates
- Funding for Universal and high quality Early Learning and Child Care
- Housing for all
- Mechanisms for levelling the playing field for marginalized people
- Universal drug and dental coverage
The Province

Lynn Hartwell
As it happens, I heard NS Deputy Minister of Community Services Lynn Hartwell on CBC’s Information Morning Cape Breton on Wednesday discussing planned changes to the province’s Employment Supports and Income Assistance program.
“A job is the best path out of poverty,” she told host Steve Sutherland, causing me to stop what I was doing (pouring myself coffee) to consider this.
What if that job is part-time or contract-based? What if it’s benefits-free? Minimum wage? Wouldn’t it be more accurate to say ‘Three jobs is the best path out of poverty?’ (Although not necessarily the best path to good physical and mental health.)
And what if there are no jobs? Sydney-Victoria has an unemployment rate of 18.9%, which suggests finding work is difficult for the able-bodied. How much more difficult must it be for people on Income Assistance, many of whom — as the Deputy Minister herself acknowledged during the interview — struggle with mental illness or addiction or physical disabilities?
Turns out, I’m not the first person to wonder about this. Nick Jennery, executive director of Feed Nova Scotia, beat me to it, writing to the Coast in March 2018, just after the Department of Community Services announced the planned changes, to point out that:
[O]nly 35 percent of the department’s caseload is close to the labour market, which means the announced changes provide little hope for Nova Scotians on income assistance who are unable to work for a variety of reasons, like long-term disability or mental health challenges.
For those who do not find jobs and remain on Income Assistance, this government, in keeping with its practice of throwing social services nickels around like manhole covers, will increase basic support rates by 5% (which works out to roughly $20 a month, apparently).
I’ll let Nick Jennery respond to that:
A five percent increase to their basic allowance will not have a meaningful impact.
Our provincial government is much happier giving money to businesses than giving money to people, even though we’ve been repeating this experiment in trickle down economics for roughly 50 years without success.
The Municipality
 The CBRM is located within Sydney-Victoria, so obviously, child poverty is an issue here.
During its most recent meeting, CBRM Council heard from municipal CFO Jennifer Campbell on the subject of a revised low-income tax exemption. Campbell recommended that income thresholds (which hadn’t been updated since 2008) be revisited, as the eligibility criteria were “unreasonably low.” Campbell recommended the municipality move to a combined household income approach, using the federal government’s combined family income threshold for Old Age Security and the Guaranteed Income Supplement — in 2018, that threshold is $23,616.
The exemption is to be increased from $125 to $225 per qualifying household per year.
Council approved the recommendations unanimously, so that’s something.
But much of the responsibility for combating poverty in the CBRM seems to have been off-loaded onto charities. In fact, rather than going to the mayor of the CBRM or the MP for Sydney-Victoria for comment on the Campaign 2000 findings, the Cape Breton Post went to Lynne McCarron, the head of the United Way. (Try to avert your eyes from the accompanying photo with the caption: “This stock image illustrates the despair felt by a child living in poverty.”)
McCarron, I have to say, sounded pretty defensive:
I know people are discouraged by the numbers, but it’s not as if nothing is being done about the issue — we’re not going to see evidence of change just yet, but that doesn’t mean we stop doing what we are doing.
Right now, the research is based on old data — once the impact of the money we are spending is reflected into that study, that’s when we hope to see better numbers, so I’m not expecting to see significant change until the next long form audit.
I don’t think anyone is suggesting the United Way stop what they’re doing but I do think this might have been a good moment for the head of the United Way to call on others — namely, the municipal, provincial and federal governments — to do more. Or are we really just to sit back and wait for the results of the next long-form Canadian Census — which is scheduled for 2021, so won’t actually produce data until 2022 — to decide whether we’ve succeeded in reducing child poverty in our community?
Poverty Index
I couldn’t resist the temptation to do a Harper’s Index style breakdown of some of the relevant child poverty numbers from the Campaign 2000 report (with a few other numbers I happened to have lying around thrown in for good measure):
Number of federal ridings in Nova Scotia: 11
Number of those ridings in the highest quintile for child poverty: 5
Number in the fourth-highest quintile for child poverty: 4
Number in the lowest quintile for child poverty: 0
Percentage of Nova Scotia federal ridings with child poverty rates above the 17.4% national average: 91
Number of federal ridings encompassing Cape Breton: 2
Number of those ridings in the highest quintile for child poverty: 2
Year child poverty was to end in Canada, according to a 1989 all-party House of Commons resolution: 2000
Percentage change in child poverty in Nova Scotia since 1989: +19.3
Year Mark Eyking was elected MP for Sydney-Victoria: 2000
Year Rodger Cuzner was elected MP for Cape-Breton Canso: 2000
Percentage of people in highest quintile ridings who are recent immigrants: 15.7
Percentage of people in highest quintile ridings who are visible minorities: 37
Percentage of lone-parent families in highest quintile ridings: 21
Percentage of lone-parent families in Sydney-Victoria: 26.4
Chance a household in the highest quintile spends more than 30% of its income on shelter: 3 in 10
Percentage of highest quintile households who are renters: 45
Average monthly rent for a one-bedroom apartment in the CBRM: $650
Maximum shelter allowance for Nova Scotians on provincial assistance: $535
Number of children living in poverty in Nova Scotia: 35,890
Average unemployment rate (ages 15 and over) in the highest quintile: 9.5%
Unemployment rate in Sydney-Victoria: 18.9%
Percentage of NS children living in poverty who reside in ridings classified as rural: 71.5
Chances an Aboriginal reserve in Canada has a median income below the poverty line: 4 in 5
Rank of Sydney-Victoria among NS ridings for percentage of residents indicating Aboriginal identity: 1
Index Sources: 1,6 Elections Canada; 2,3,4,5,7,12,13,14,16,17 Campaign 2000; 8 House of Commons Journals; 9,20,22 Canadian Centre for Policy Alternatives; 10, 11 Wikipedia; 15, 21 2016 Census; 18,19 2016 Homeless Count Committee; 23 Canadian Press
[signoff]